DENSITY EVOLUTION p(x,t) over PROCESS-TIME — Fokker-Planck view (PRIMARY)
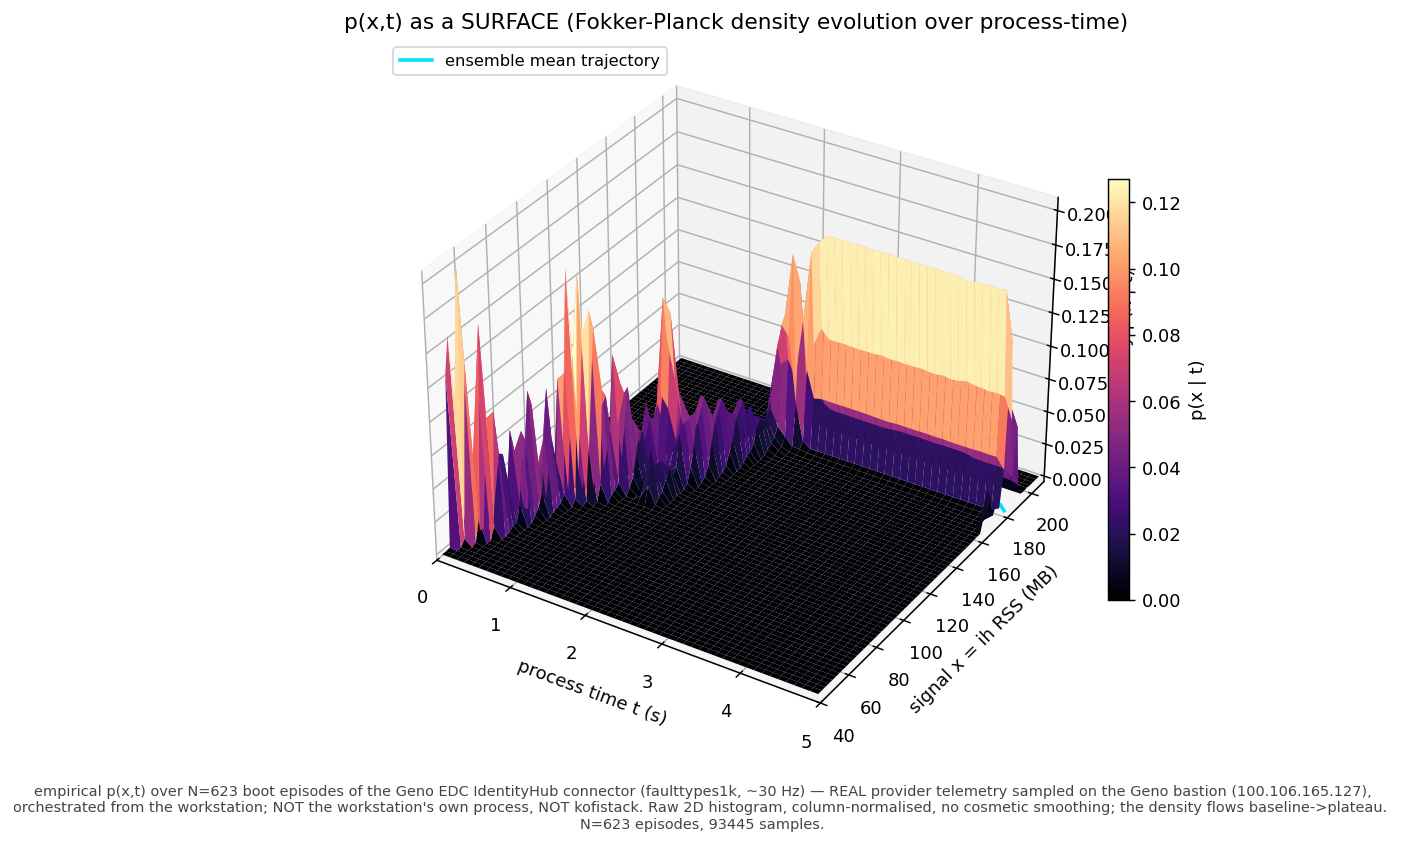
p(x,t) as a 3D SURFACE (same matrix; Z = p(x|t))
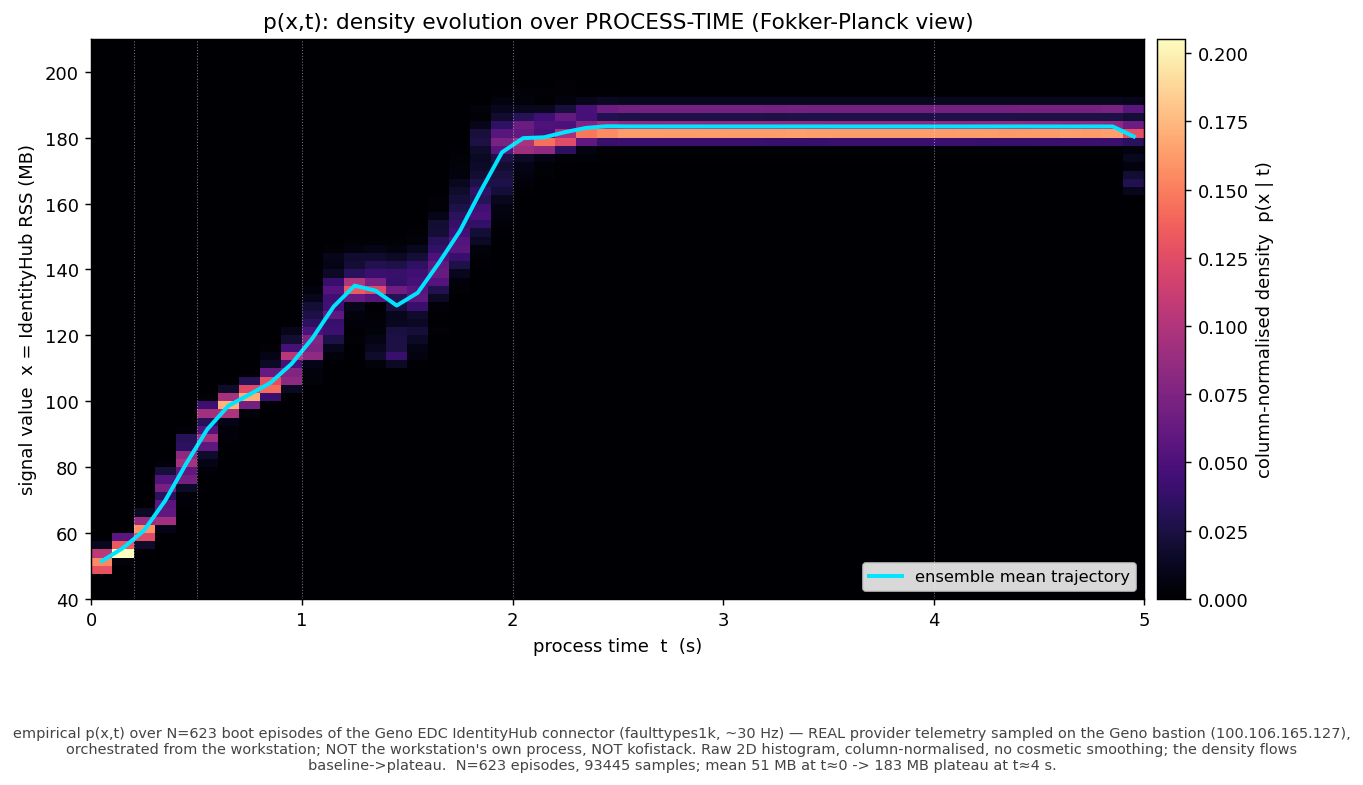
The TRANSIENT p(x,t): the empirical density flowing from the ~48 MB process-start
baseline, up and widening through the boot ramp (t≈1 s), settling into the plateau band by t≈2–4 s. This is the
"changing signal" — it comes from the ih boot corpus (faulttypes1k, 30 Hz, N=623 episodes), which is the
only place the boot ramp is sampled fast enough to resolve. Raw column-normalised histogram, no KDE / cosmetic
smoothing. With/without the boot: /pxt_with_boot.png ·
/pxt_plateau_only.png (the plateau is ~32× smoother — the roughness is the transient).
Note on "live": the campaign runs are sampled slowly and start already booted, so their p(x,t) is a flat plateau with no transient — see /pxt_campaign.png. A live current-regime transient would need a dedicated high-rate boot campaign. The LIVE, updating view is the plateau-distribution panel below (SEM ~1/√N).
Note on "live": the campaign runs are sampled slowly and start already booted, so their p(x,t) is a flat plateau with no transient — see /pxt_campaign.png. A live current-regime transient would need a dedicated high-rate boot campaign. The LIVE, updating view is the plateau-distribution panel below (SEM ~1/√N).